
![]()
EIQ Diagnostics Tool
Version 8.0.0.490
Viewing
Diagnostic Messages for a Component Viewing
Messages from Multiple Components The EIQ Diagnostics Tool is used to view diagnostic
messages from SDF configuration and management components (SDFPostgreSQL query
server and its query client components are excluded). This diagnostic trace
aids users and developers in tracking down and diagnosing any issues with
SDF configuration and management components. For diagnostic logs for SDFPostgreSQL query
server and its query client components, please refer to PostgreSQL v14
documentation. https://www.postgresql.org/docs/14/runtime-config-logging.html Each SDF component (executables and libraries) writes
diagnostic messages to Windows message sinks. The EIQ Diagnostics Tool
taps into these message sinks and displays messages as they arrive. Users must
open a diagnostic window for each component they are interested in monitoring. Users don't have to setup the diagnostic message
sinks. Components create message sinks when they are loaded for
the first time. These message sinks are local to the machine, so the
Diagnostics tool must run on the same machine where the components
are running. Note: A single
library component can be loaded by multiple components at the same time. For
example, the WhamNAPI component may be loaded by
both the EIQ Server and the EIQ Server Configuration Tool
components. Each loaded instance of the component creates its own sink
identified with a unique name composed of its own name and the name of the
loading component. Using the previous example, 'User1_WhamNAPI_EIQServer' and
'User1_WhamNAPI_EIQServerConfigTool' could be two sink names for the two loaded
instances of WhamNAPI library. ·
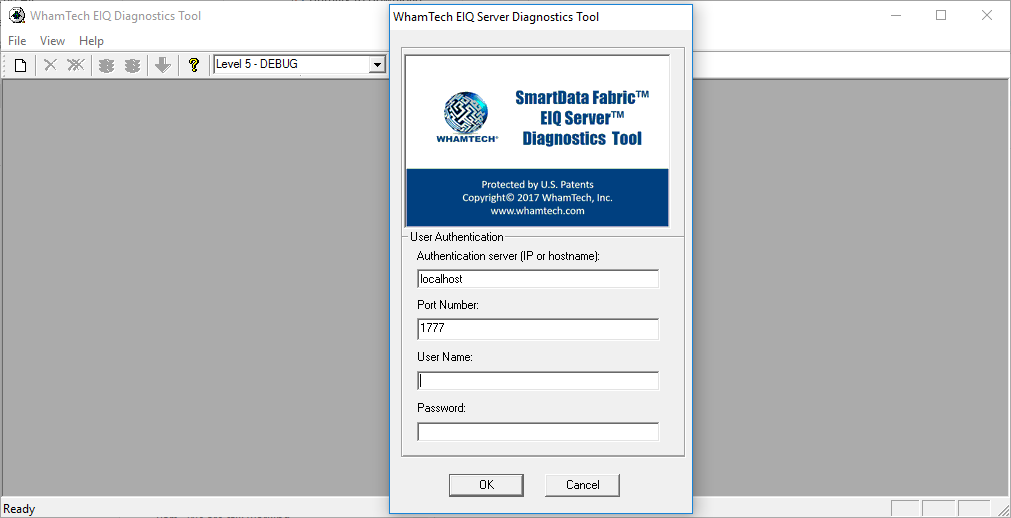
Start the 'EIQ Diagnostics Tool'. ·
Sign in with your username and password. ·
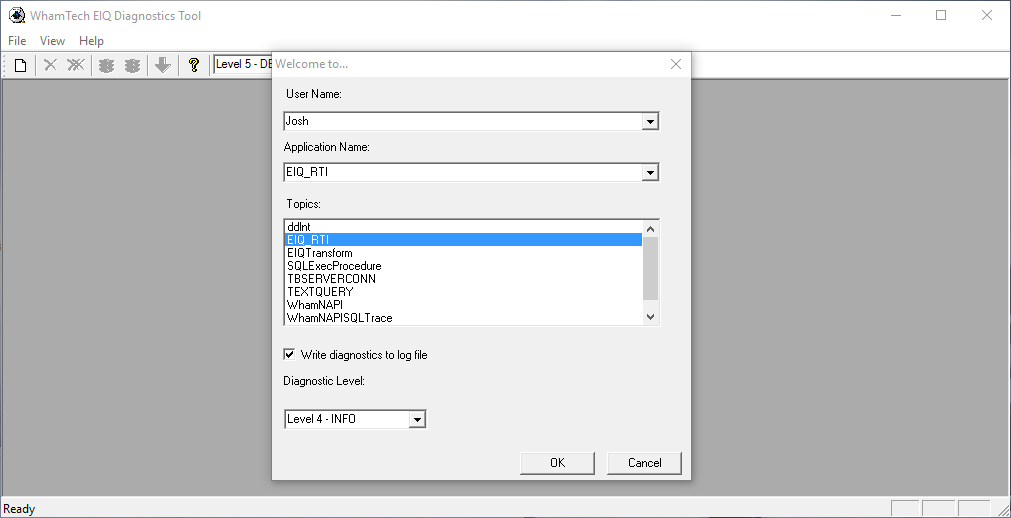
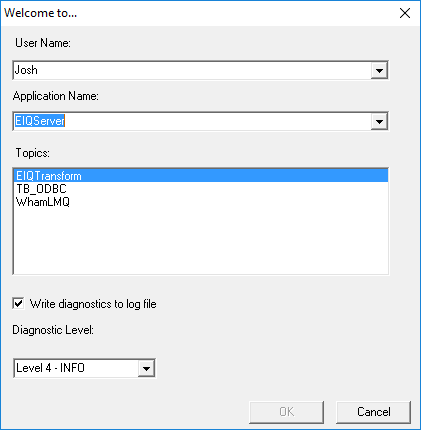
Select the application name from the drop-down list
of registered EIQ Product Suite components. ·
Click 'OK'. ·
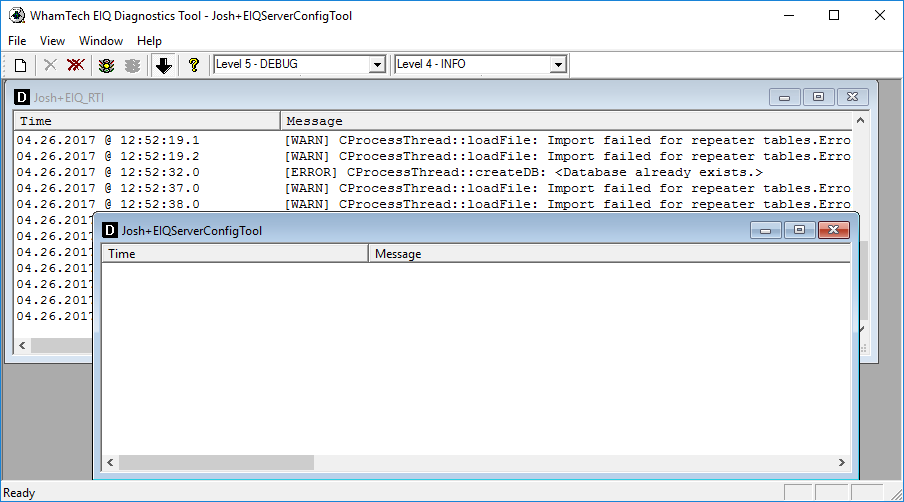
The EIQ Diagnostics Tool opens a message window
where the diagnostics messages are displayed for the selected component. ·
User can see any diagnostic messages as they are
posted by the component in the window. To watch messages for more than one component at the same
time, click 'File->New' and select the component name. It opens a new
message window for diagnostic messages from the selected component. Users can save messages to a log file. When users select a component, by default the 'Write
diagnostics to log file' option is selected. This writes diagnostic messages to
a log file named after the component under the 'WhamTech\log' folder in the
install path. Users can also save messages to a log file by clicking
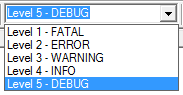
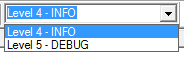
'File->Save'. The diagnostic level can be changed in both the
component selection window and in the main program window. There are five
levels. Level 1 – FATAL: A
very serious error has occurred that can lead to the application aborting. Level 2 – ERROR: An
error has occurred but the application may still continue to run. Level 3 – WARNING: There
is a potentially harmful situation occurring. Level 4 – INFO: Provides
informational messages highlighting the procedures of the application. Level 5 – DEBUG: Provides
details on informational events that are useful in debugging the application. Levels 1-5 can be selected from the main program window
after loading the component being diagnosed. Levels 4-5 can be selected from
the second drop-down bar in the main window or from the component selection
window. To clear messages from the currently highlighted window, use
the To filter-out unwanted messages, select 'View->Filter
Messages' and enter a keyword that must be present in a diagnostic message. All
messages without the keyword will not appear in the message window. By selecting 'Windows->Cascade' or 'Windows->Tile',
users can re-arrange multiple message windows. Users can pause or resume receiving messages in a message
window by clicking the icons for pause and resume. Selecting 'pause' for an
active window halts diagnostic message retrieval for that window. ‘Resume’
starts receiving diagnostic messages from that point in time. Even after a
resume, a message window does not display any messages output by its
application during the 'pause' period. EIQ Diagnostics Tool Features
Viewing
Diagnostic Messages for a Component
Viewing
Messages from Multiple Components
Saving
Messages to Logs
Diagnostic Levels
Diagnostics
Tool Options
Clearing
Messages
![]() icon on
the toolbar. To clear the messages from all the windows that are open in the
current session, click the
icon on
the toolbar. To clear the messages from all the windows that are open in the
current session, click the ![]() icon on the toolbar.
icon on the toolbar. Filtering
Messages
Arranging
Message Windows
Pausing
and Resuming Messages
Copyright
© 2023 , WhamTech, Inc. All rights reserved. This document is
provided for information purposes only and the contents hereof are subject to
change without notice. Names may be trademarks of their respective owners.